Detailed reports allow you to find out whether your agents are coping with the incoming flow, how quickly they respond to customers, and who is performing the best. Reports consist of subsections with all necessary indicators, and the data can be viewed by an agent (assignee or participant), group, or team as a whole.
In the administrator's account, the corresponding section displays all available indicators for all agents. In the agent's account, the Dashboard displays key data only for the owner of a particular account and its cases.
Let's review in detail the general principles of operation and features of each subsection.
Table of Contents
General aspects:
Reports subsections:
General aspects
1. Filters
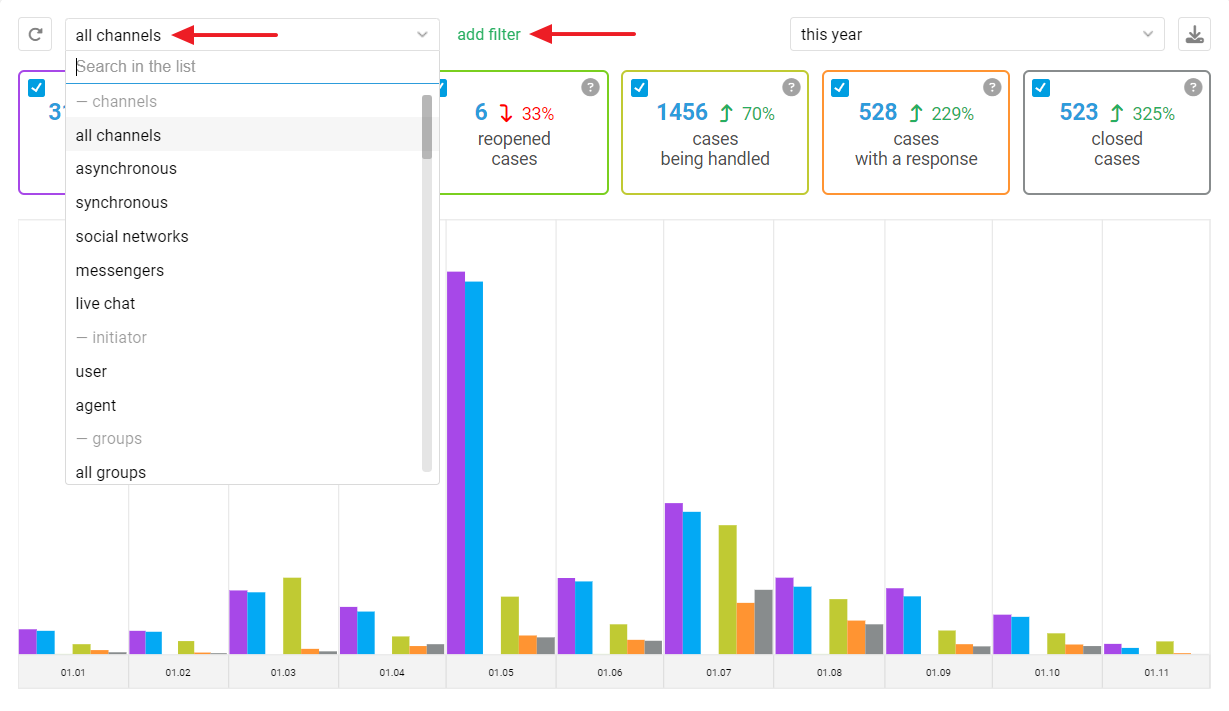
Use filters to see the indicators only for cases with the required parameters.
а. Select one of the standard filters or create your own.
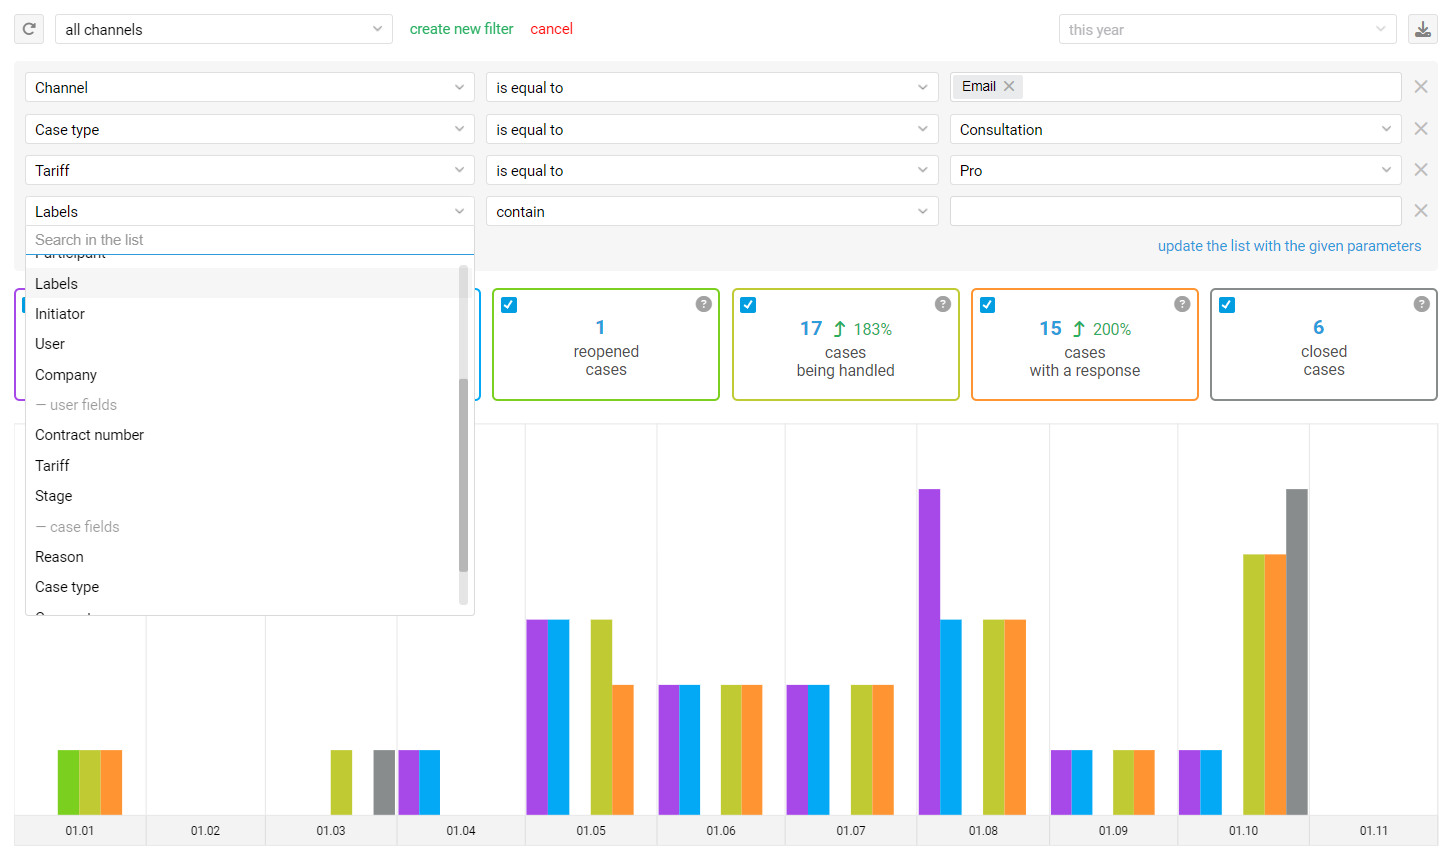
b. You can use both standard user and case fields and custom fields as filtering parameters when creating your own filters.
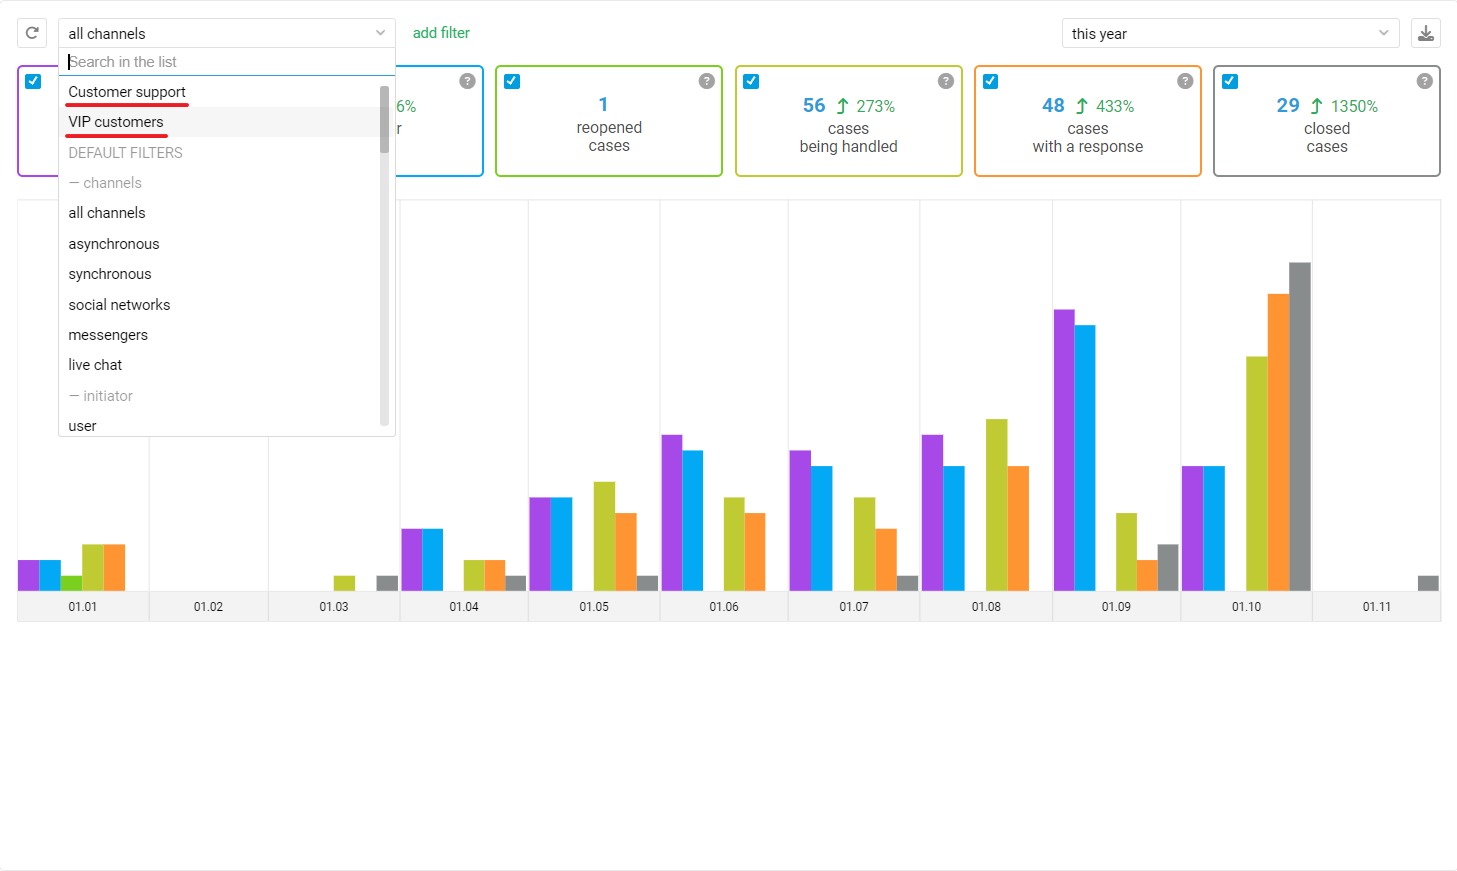
c. If you need to frequently filter statistics by certain parameters, save custom filters so you can easily switch between them.
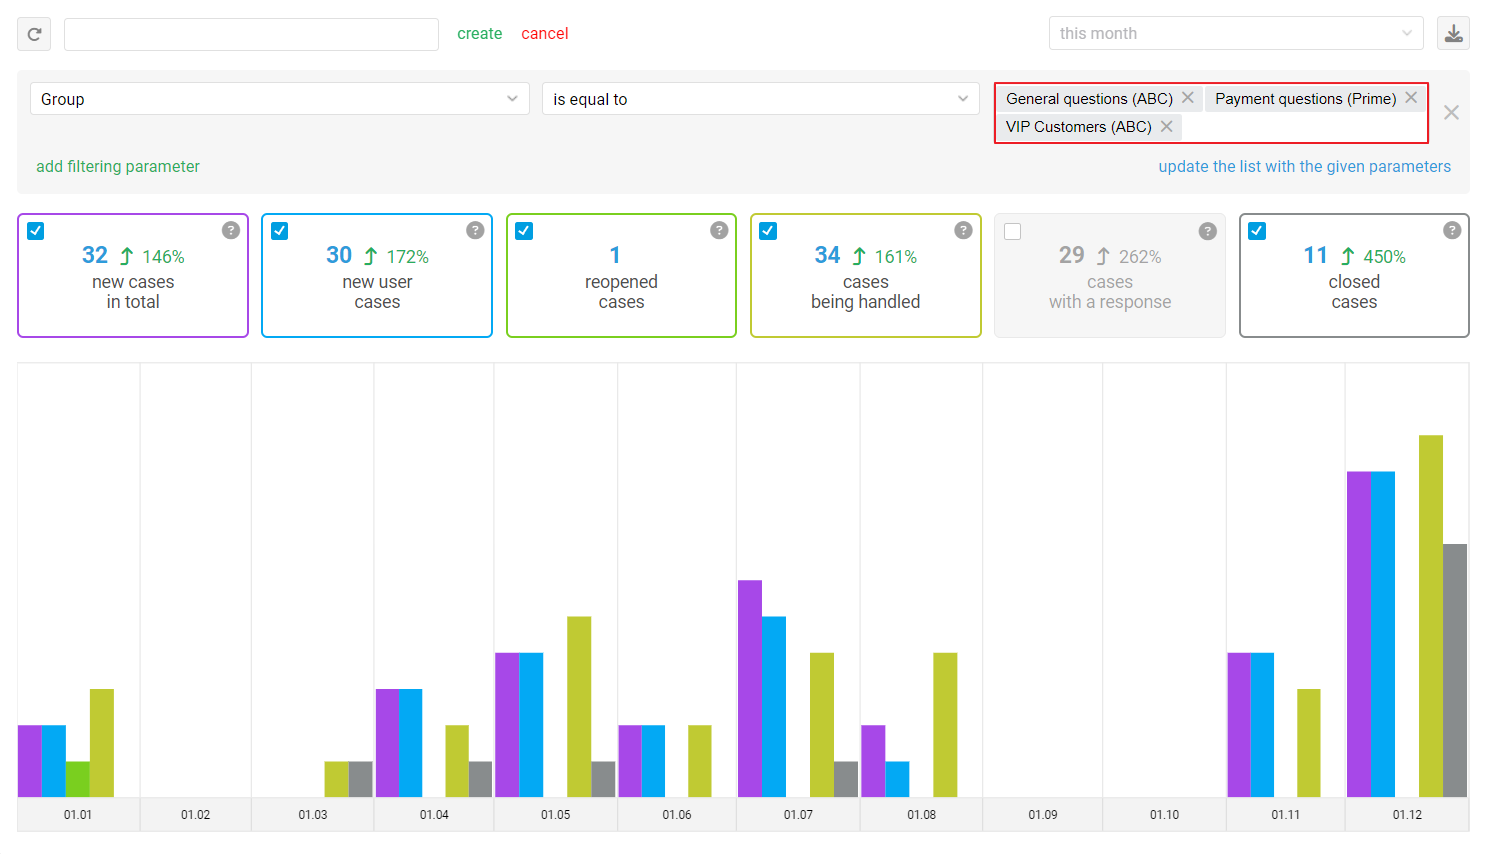
d. If you need summarized data for multiple groups, agents, or channels, specify them in one filtering option.
2. Assignees and participants
You can choose the counting logic you want:
a. Based on the assignee
By default, all data take into account the current case parameters, including the current assignee. For instance, if you select the "Channels — asynchronous" filter, the indicators are calculated for the current assignees in cases, even if they have not performed any actions in them.
It is precisely the current assignee of the case that is being considered. If agent D is now the assignee, but before that agents A, B, and C were assignees for the same case, then the case will be recorded only for agent D.
b. Bases on the participant
However, if the current assignee in the case is not important and you want the indicators to be recorded for each agent who participated in the correspondence with the customer (sent at least one response), then filtering by participants is optimal.
To include participants in the indicators, you should either select the "all participants" filter or create a custom filter with the "participant" filtering parameter.
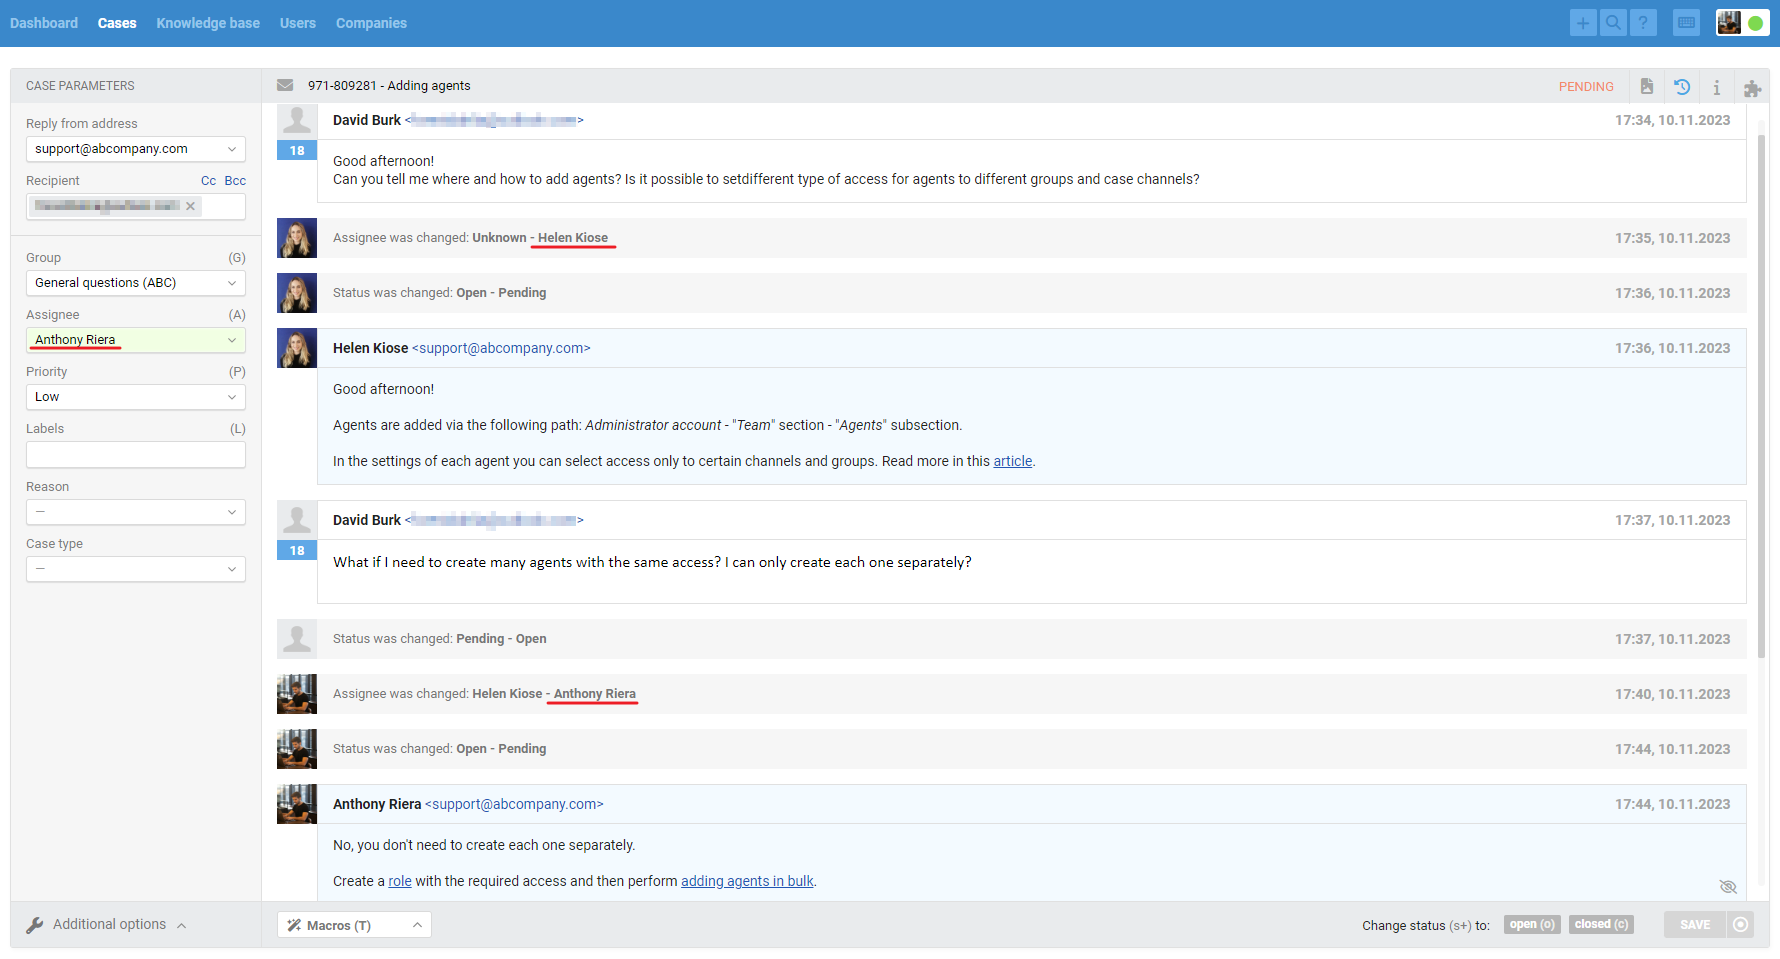
Logic clarification with a particular example
An incoming case where:
— Helen Kiose was the assignee, and she sent a reply;
— Anthony Riera was the assignee and he also sent a reply.
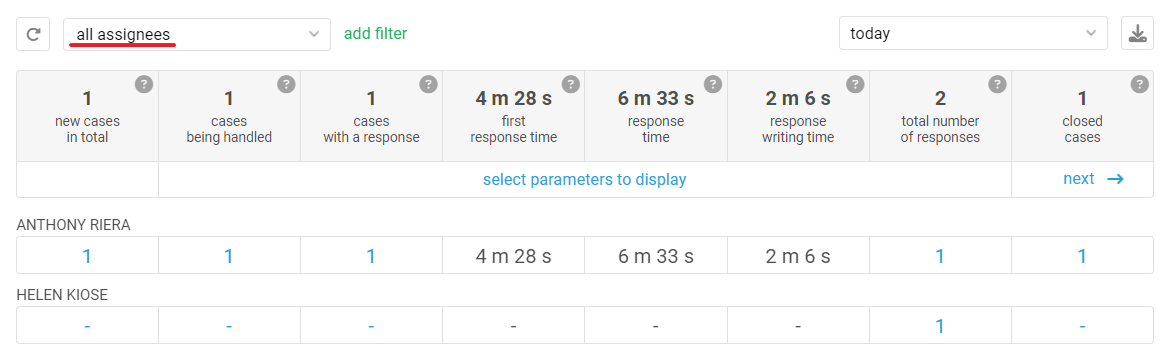
а. With any filters, except for filters based on participants, the case is registered only for the current assignee — Anthony Riera, and all work and response rates are counted for him, even if they are someone else's responses and actions. For example, Anthony Riera did not send the first response in a case, but since the data is reviewed based on the assignee, the speed of the first response in the case is recorded for him.
b. If you select the "all participants" filter, the case will be counted for both agents, as each agent sent a response in the case. Response rates will be counted for both agents — separately for the responses that each agent sent.
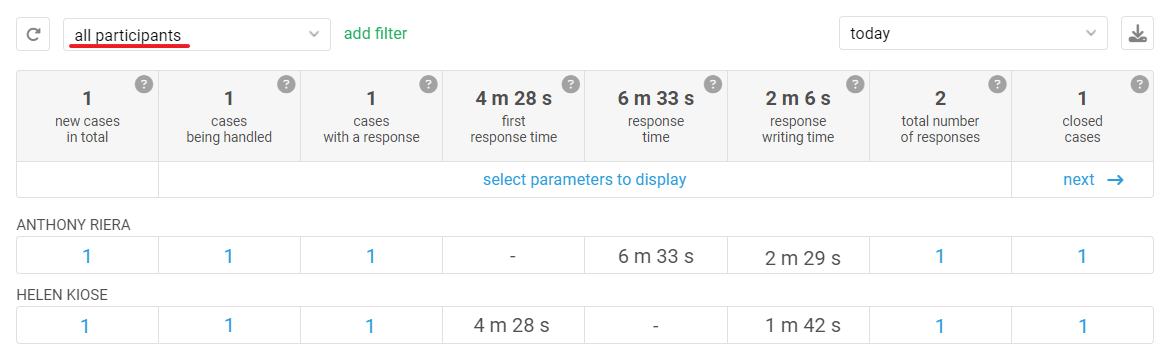
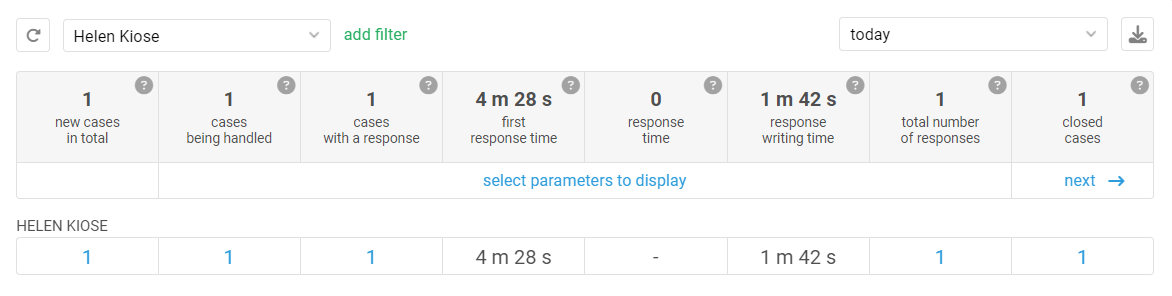
The indicators by the number of cases in the table header (new cases in total, cases being handled, cases with a response, closed cases) display the actual number of cases rather than the sum of indicators for each agent. In total, one case was received, but two agents participated in it, so the case was counted for each agent, but the header still displays only one case.
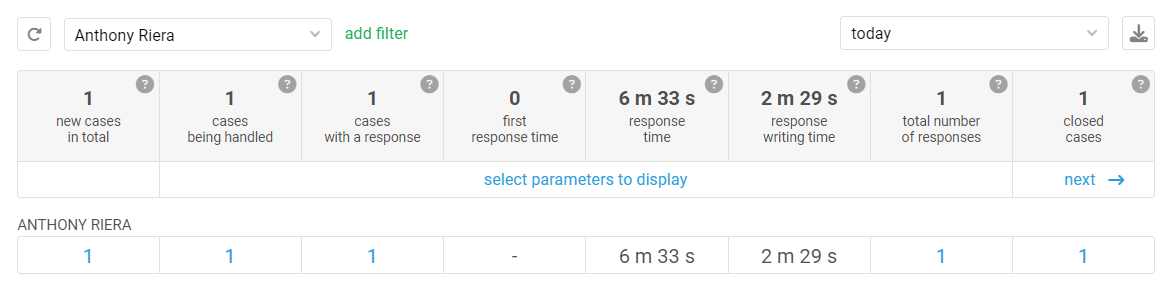
c. If you select participant-specific filters, the case will also be fixated for each agent.
3. Exporting indicators
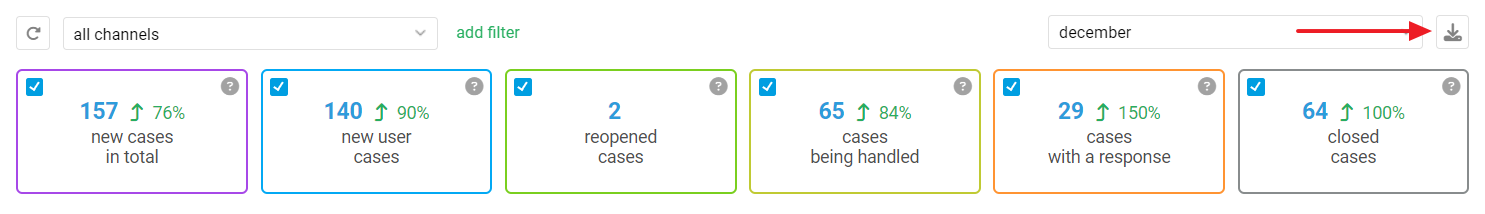
Indicator values can be exported in CSV format via the upload icon in the upper right corner of the subsections.
This allows you to share data with colleagues who don't have access to reports or keep a history of changing metrics.
4. Exporting cases and responses included in the calculation of the indicators
For almost all indicators, it is possible to export cases or responses to check which data was used for calculation. For instance, if you have received numerous cases within a specific period, and you want to understand their nature (technical problems, promotions, etc.), you can export the data for analysis. Alternatively, if one of the agents has an excessively high first response rate, you need to determine the cases where customers had to wait for a response too long.
The values of the indicators that can be downloaded are blue in color. To perform the export, it is enough to click on the value of the indicator itself.
5. Indicators description
Each indicator has a question icon. Hovering over this icon reveals a comprehensive description of the parameters taken into account during the calculation of the respective indicator.
6. Selecting a period
To access detailed reports for a specific timeframe, navigate to the upper right corner and utilize the drop-down menu. Here, you have the flexibility to select both standard (today, yesterday, last week, etc.) and custom values (specific hours, specific day, and specific period).
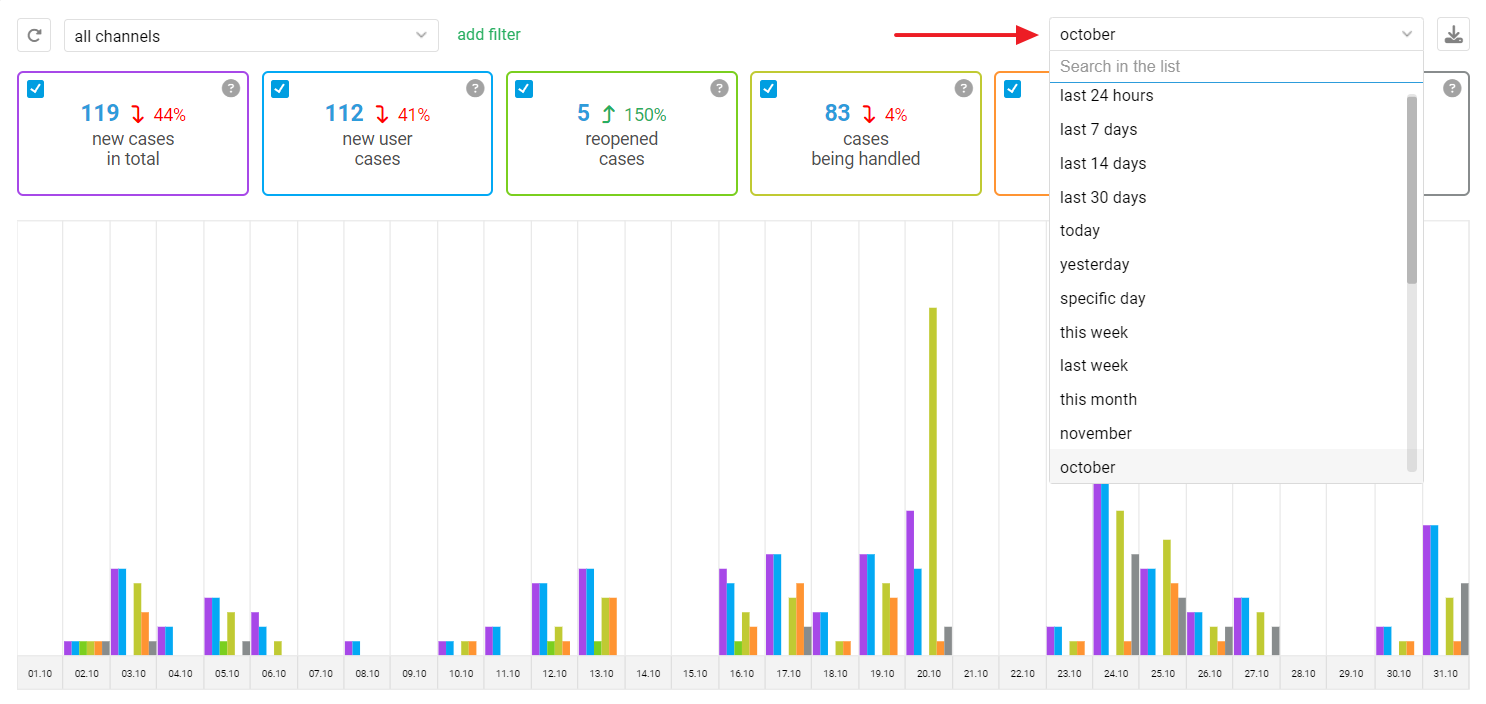
When selecting the options "last 24 hours," "last 7 days," "last 14 days," and "last 30 days," the data is displayed from the current moment.
For example, if it is currently 15:31 and you are viewing reports for the last 24 hours, the displayed data will range from 15:31 (yesterday) to 15:31 (today).
You cannot select specific hours or a specific day in the Peak Load subsection. It displays data for at least a week, so it is available only if the period contains all days of the week (seven horizontal blocks) and all hours (twenty-four vertical blocks).
7. Saving selected view settings
а. When you select a filter and period in one subsection, Deskie leaves these settings for other subsections as well, until you change them. For example, you have selected the filter "synchronous channels" and the period "April" in the "Overall workload" subsection. When you go to the "Time metrics" subsection, you will immediately see the data for these same settings.
The logic will not function within the "Activity Feed" and "Agent Statuses" subsections since they present a different data type, not statistical metrics that can be compared with each other
b. Separate custom statistics filters are used for each sub-admin, along with the current filter and period in the reports subsections. If different admins look at, for example, reports for different departments of the company, they will not interfere with each other.
8. Speed indicators
а. The metrics related to speed take into account the business schedule set in the administrator account or, in the case of service level agreement (SLA) metrics, the time specified in the option settings.
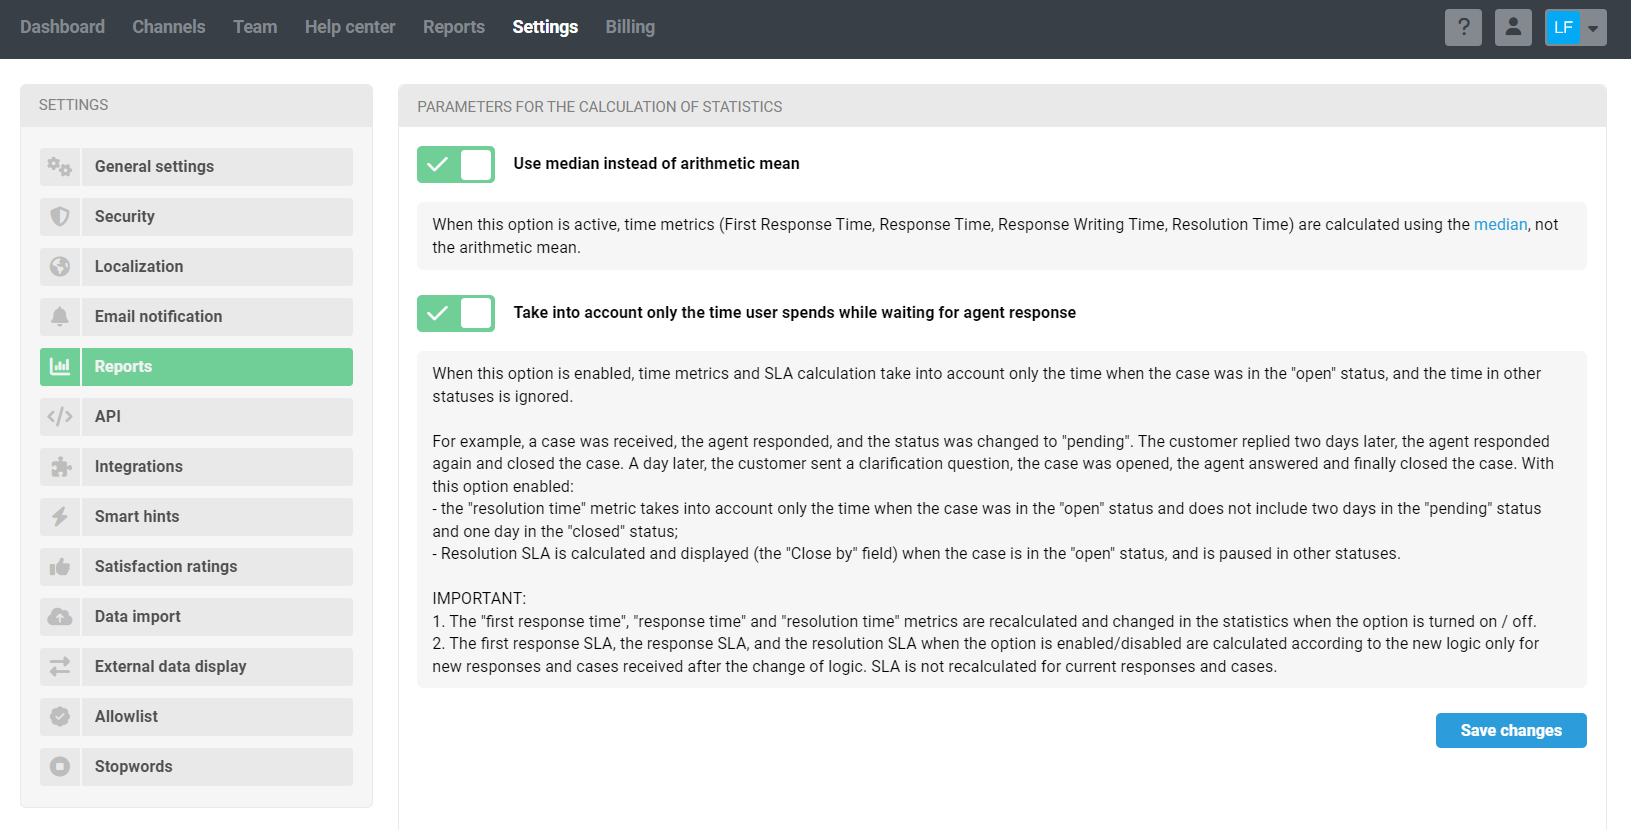
b. For the speed indicators ("first response time", "response time", "resolution time", "first response SLA", "response SLA" and "resolution SLA") it is possible to exclude from the calculation the time when the case was in the "pending" or "closed" statuses. This way, the indicators only take into account the time when the case was in the "open" status, i.e. while the user was waiting for the agent's response.
The setting is located at the following path: administrator account — Settings — Reports subsection — "Take into account only the time user spends while waiting for agent response".
This setting also applies to the "Reply by" and "Close by" case settings related to SLA:
The "Reply by" field is recalculated when the case changes from "pending" to "open" status again;
a dash is displayed in the "Close by" field when the status is "pending" and the closing time is recalculated when the status is "open".
c. If you want, you can use the median instead of the arithmetic mean for all indicators that relate to speed. There is a special setting for this: Administrator account — Settings — Reports — Use median instead of arithmetic mean.
9. Calculation of indicators in outgoing cases
Cases initiated by agents are taken into account in the calculation of indicators but with some nuances.
a) Channel: any channel, except for the "Calls" channel
Indicators: cases with a response, closed cases, first response time, response time, resolution time, number of responses for resolution, first response SLA, response SLA, resolution SLA, total number of responses.
Calculation logic: counted if a case has at least one user response. The agent's initial message is ignored as it is not a response.
b) Channel: "Calls"
Indicators: cases with a response, closed cases, number of responses for resolution, total number of responses.
Calculation logic: they are taken into account under certain conditions:
— if a case is created manually by an agent without an actual call — such cases and the initial message of the agent are taken into account when calculating these indicators because it is assumed that the agent creates the case after a conversation with the user;
— if the case is created by a call through integration with the PBX — such cases and the initial message of the agent are taken into account when there is a record of the conversation in the case. This means that the agent has actually communicated with the user.
c) Channel: "Calls"
Indicators: resolution time and resolution SLA
Calculation logic: are counted if the creation and closing times are different. If the creation and closing times are completely the same, cases are not counted so that the rate is not zero.
10. Indicator comparison
The indicator is accompanied by the value representing the dynamic change of the indicator in comparison to a similar period in the past. For instance:
Data for specific hours is compared to a similar quantity of the preceding hours (the period from 12 pm to 2 pm is compared with the period from 10 am to 12 pm).
Today's data is compared to yesterday's data.
Data for a specific day is compared to the previous day.
Data for a specific month is compared to the previous month (April with March).
Data for a specific period is compared to a similar quantity of the preceding days (the period from 01.05 to 03.05 is compared with the period from 28.04 to 30.04).
Data for the current year is compared to the previous year.
11. Downloading large amounts of data
If you choose a long period, large customers may have a lot of cases, and it will not be possible to calculate all the indicators quickly. To prevent a scenario where obtaining data becomes challenging, we've implemented deferred loading.

12. Trash and Spam
Cases placed in the "Spam" and "Trash" filters are not taken into account when calculating statistics. The logic of counting indicators in statistics when disabling or deleting an agent is described here.
Reports subsections
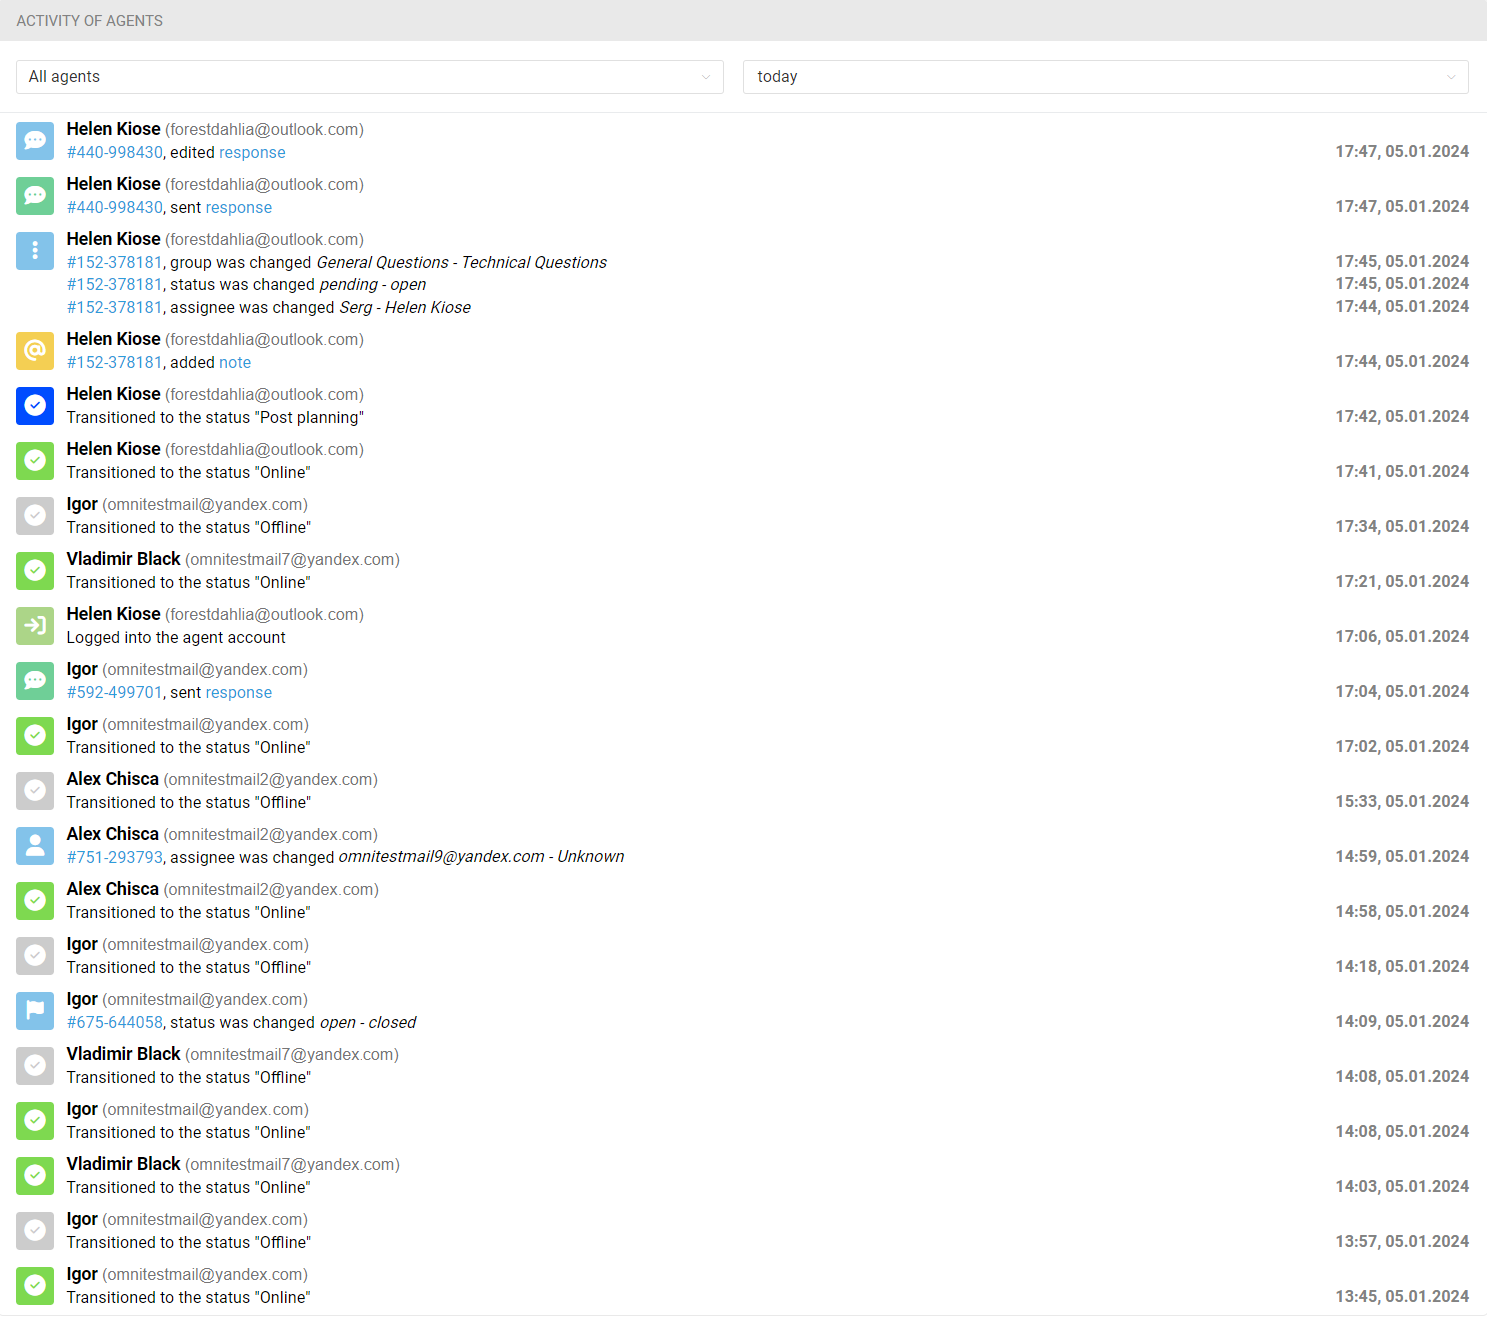
Activity feed
This subsection displays information about all agent actions:
Let's take a closer look at the potential of this functionality.
1. Events that are displayed in this subsection:
logging in and out of an agent's account;
changing the agent's status to standard or custom;
changing case parameters (status, group, assignee, priority, labels);
adding, editing, and deleting notes;
sending, editing, and deleting responses.
The "Offline" status is one of the standard statuses. An agent is marked as "Offline" under the following circumstances:
manually setting the status through the avatar menu;
after a duration specified in the "Offline" status settings, once all tabs with Deskie are closed in the browser;
when the maximum time allowed in the status throughout the day has expired;
if communication with the agent is lost due to internet connection issues for the duration specified in the "Offline" status settings.
2. Each event is accompanied by a timestamp and date. Moreover, there are links for notes, responses, and the cases themselves where changes were made, allowing for swift navigation to these elements.
3. You can select a period to display the feed:
— current (50 most recent entries displayed in real-time, without reloading the page);
— today;
— yesterday;
— specific day;
— this week;
— last week;
— this month;
— last month;
— specific date range (not exceeding three months).
When viewing the "current" activity feed, events are displayed from the most recent to the oldest. This is done on purpose so that the freshest entries are at the top. In other cases, the situation is reversed — the oldest entries are at the top.
4. Filtering data by a specific agent.
5. Exporting data to CSV (when selecting any period except for the "current" option) to thoroughly review and apply various filters in tools like Excel.
6. The activity feed contains data only for the past year (366 days). If an agent's activity is more than a year ago, it won't be possible to view it.
Agent statuses
Here, you can see when agents set various statuses for themselves, including the duration, and also evaluate the overall time of agents' activity.
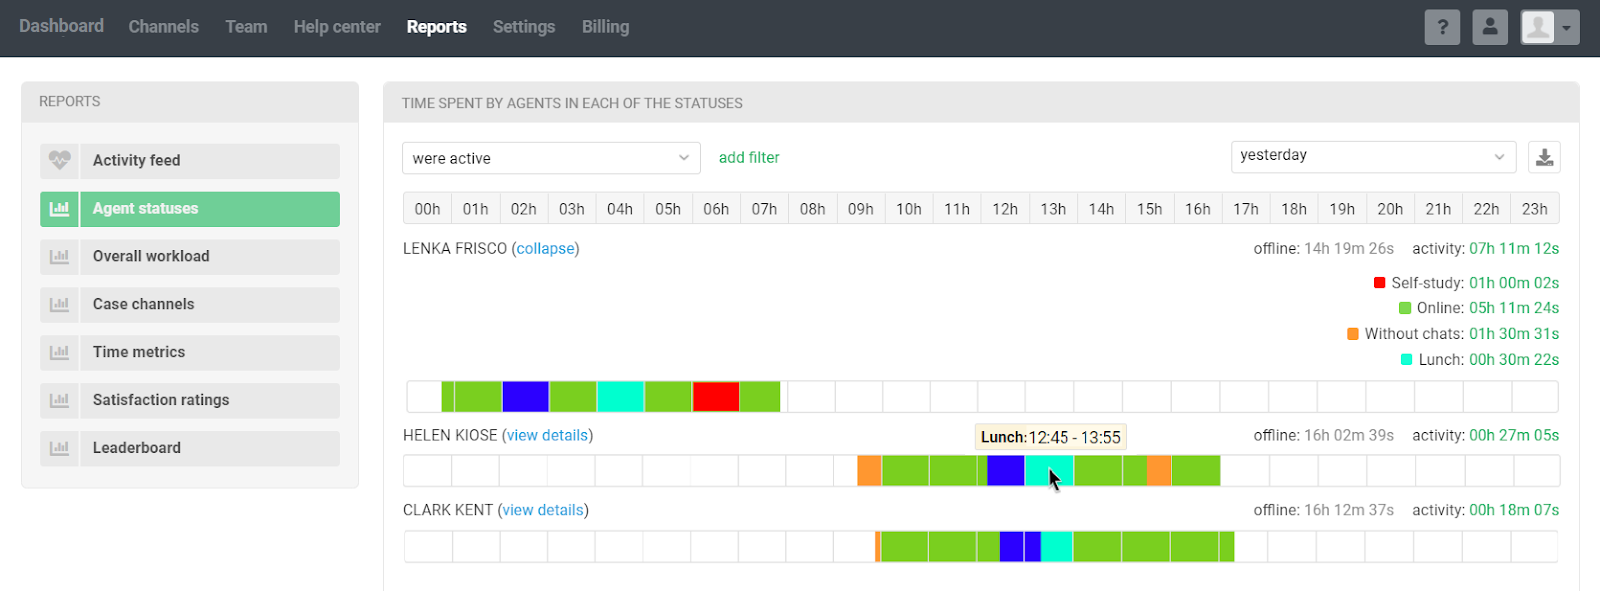
More detailed information on working with the data in this section is described in the article about agent statuses.
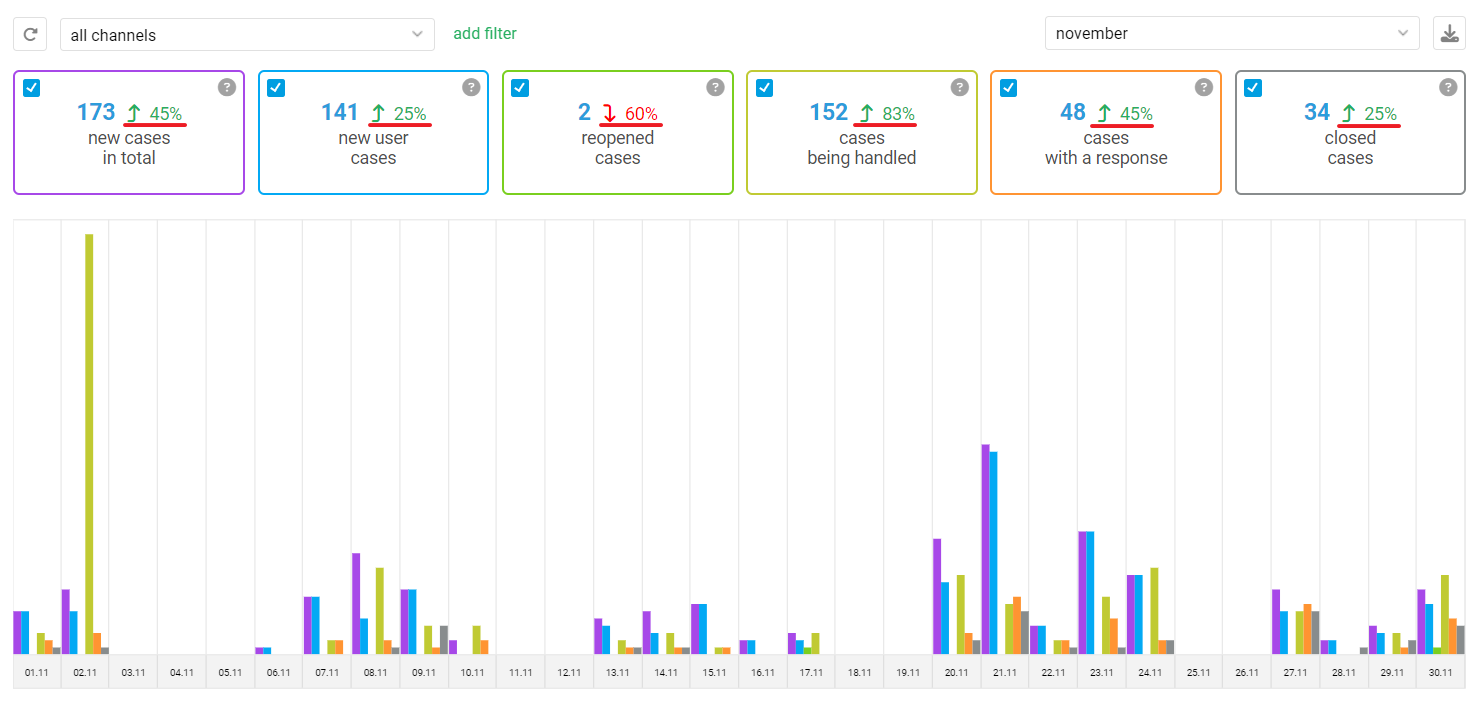
Overall workload
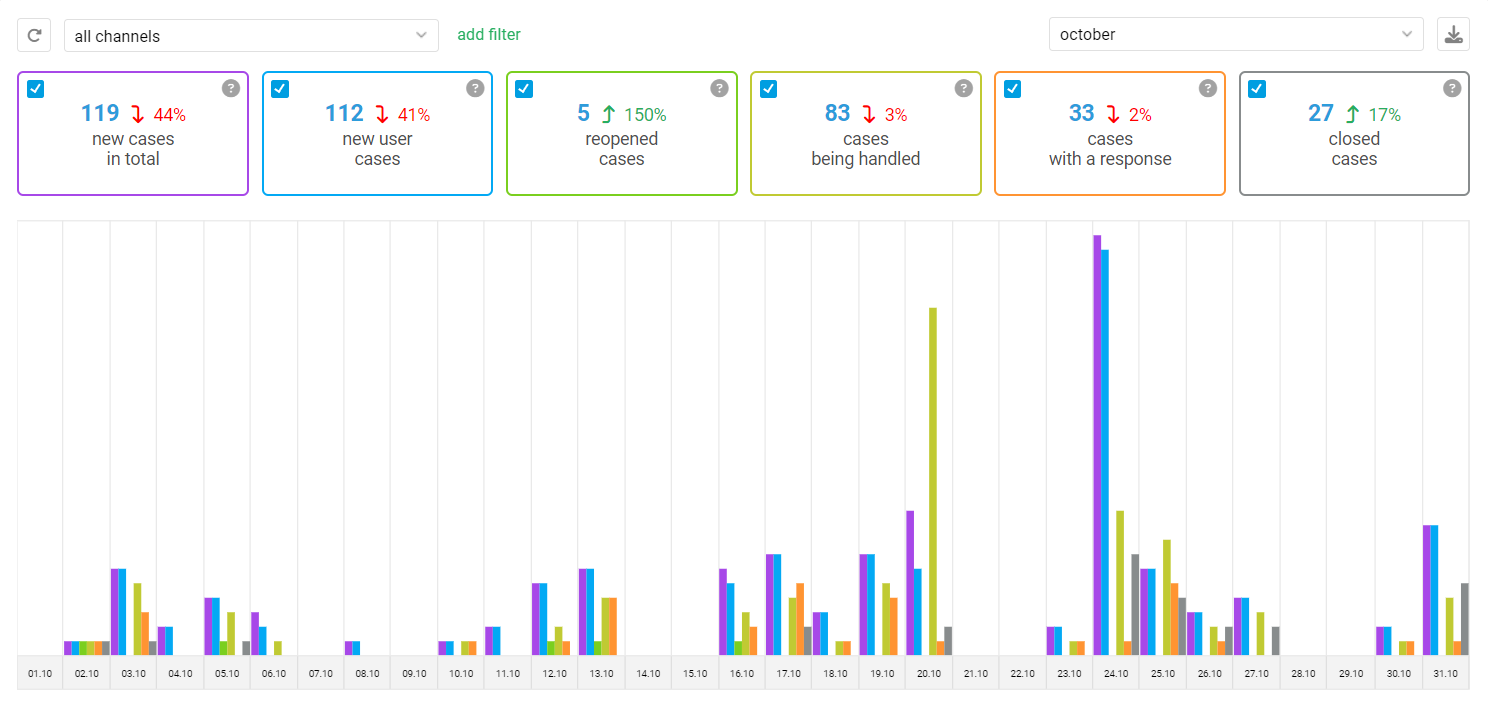
In this subsection, there are six metrics that significantly enhance the analysis of how employees handle the flow of inquiries:
new cases in total;
new user cases;
reopened cases;
cases being handled;
cases with a response;
closed cases.
Depending on the selected period, the chart is divided into different time intervals. The shorter the selected period, the smaller the time intervals corresponding to each column.
Peak load
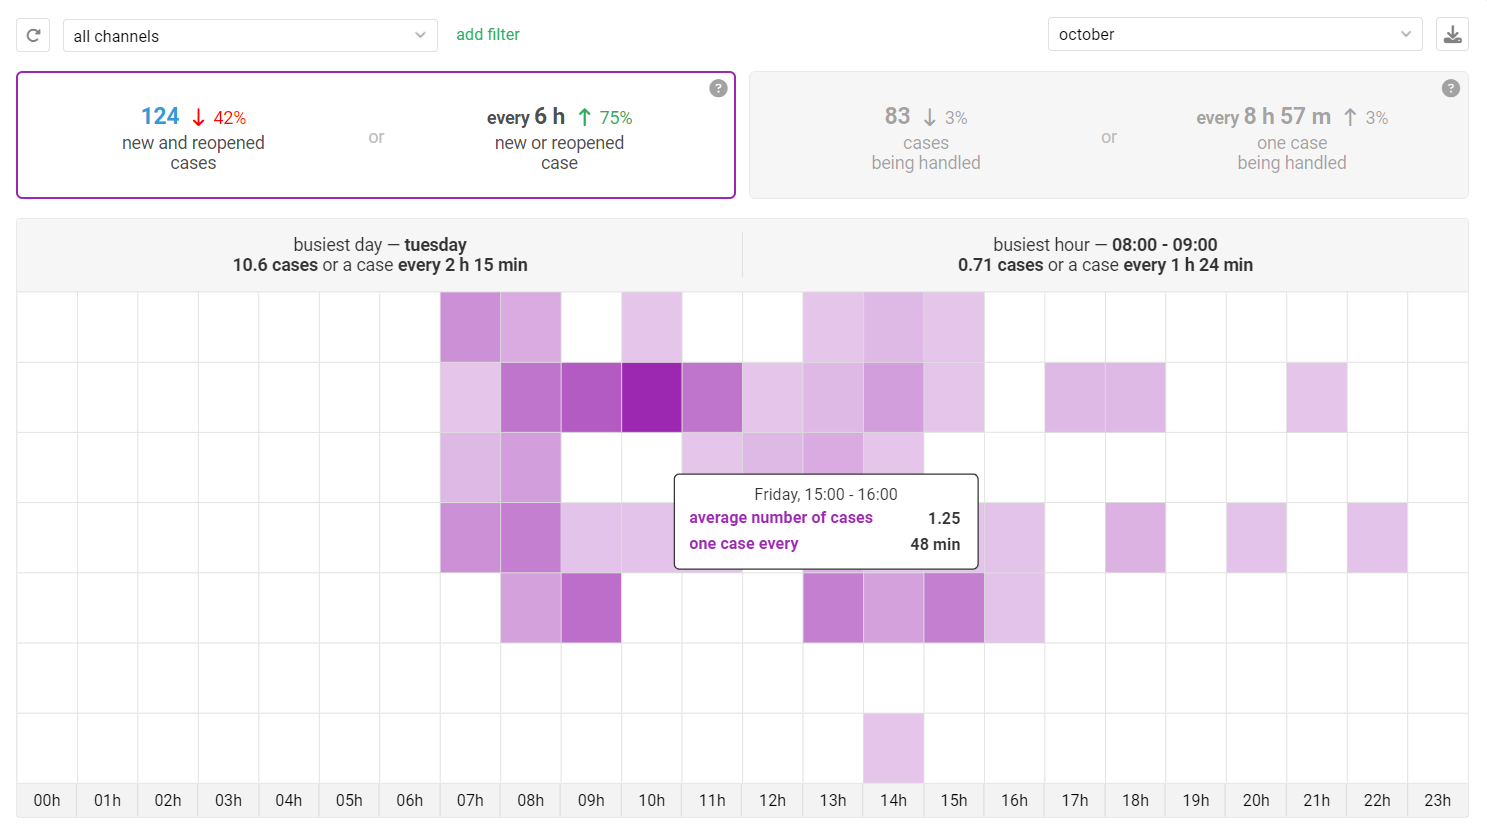
This subsection allows you to determine the most and least busy days and hours.
The chart is divided into seven rows corresponding to the days of the week (top row — Monday, bottom row — Sunday), and twenty-four columns corresponding to the hours in a day.
In the subsection header, information about the busiest day and hour is immediately displayed, and when hovering over any cell in the chart, information about the specific day and hour is shown.
If you choose an extended period, the average value for all specified days or hours is displayed. For example, in October, there were four Fridays, one of which was busy, and the others were not. In this case, Friday is unlikely to be the busiest day.
Case channels
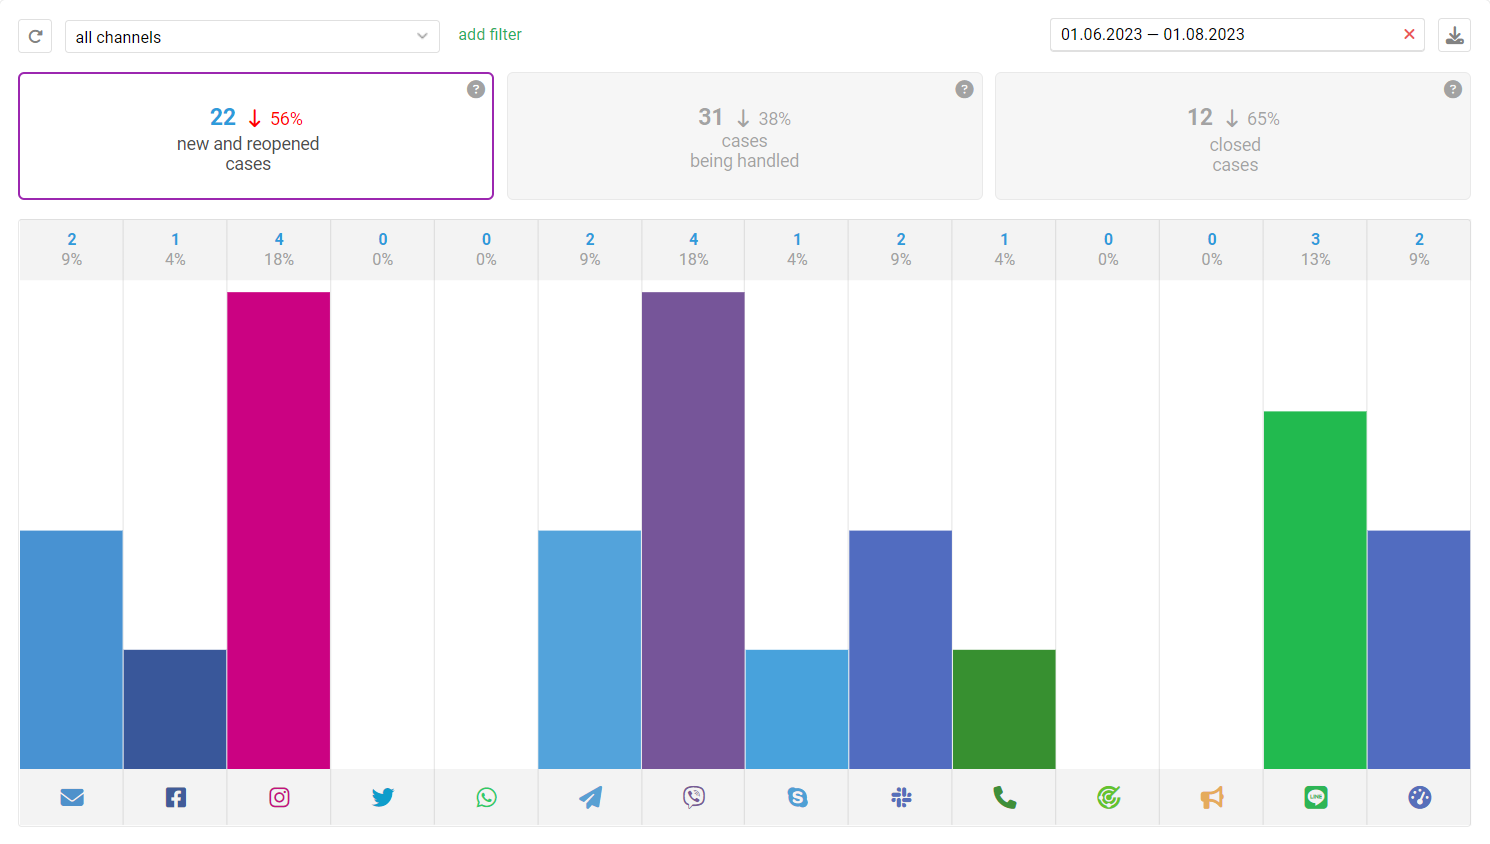
In this subsection, there are three indicators based on which the chart is constructed, making it easier to identify the most popular channels. In the column header, both the number of cases per channel and their percentage of the total are displayed.
Time metrics
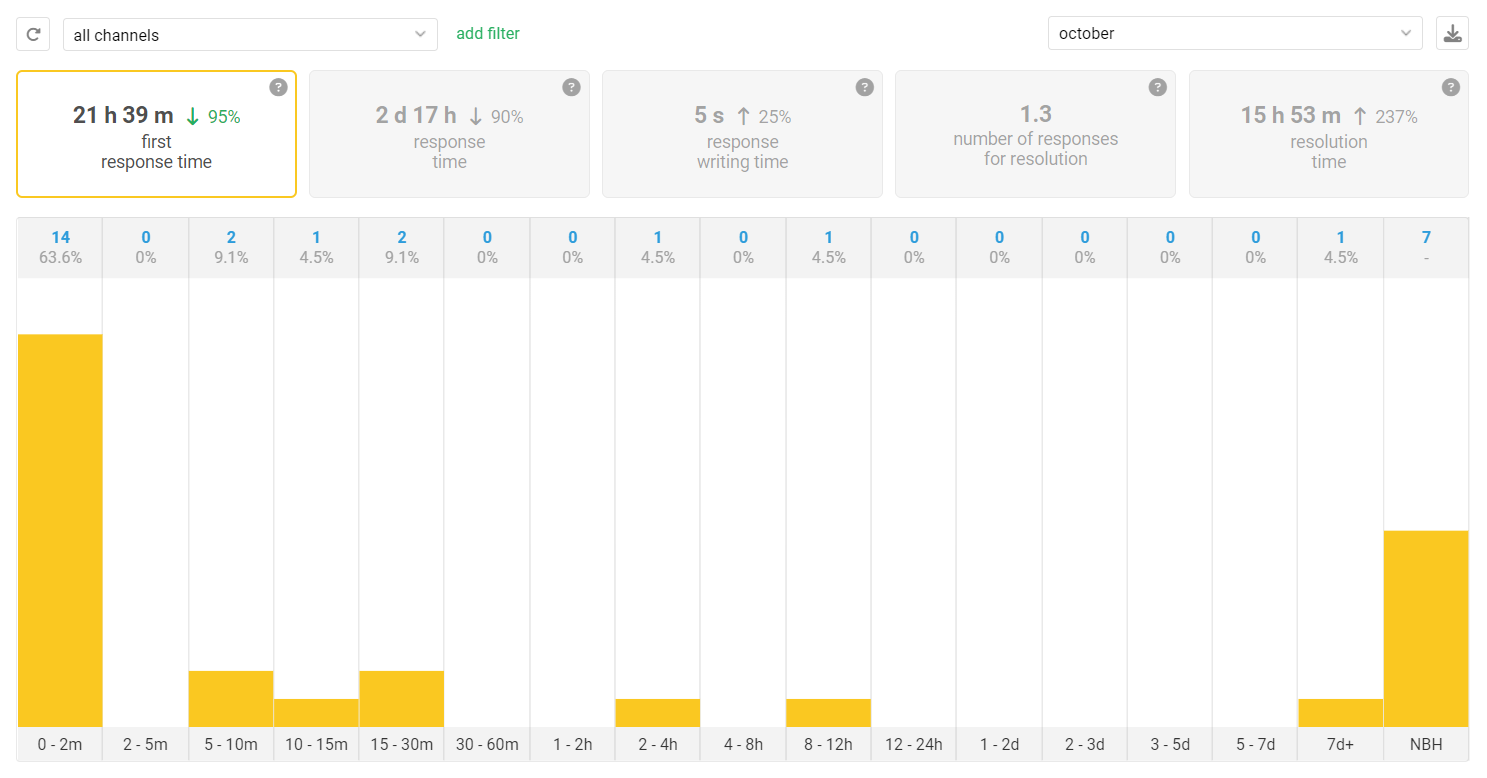
The efficiency of work can be monitored through five indicators: average first response time, average response time, time to write a response, average number of responses for resolution, and average resolution time for cases.
The First Response Time, Response Time, and Resolution Time have a column called "NBH" (non-business hours). This column records responses and cases that were not taken into account when calculating the speed indicators because they were received and processed during non-business hours. Sometimes it can be useful both to see their number and to upload the list for review.
SLA compliance
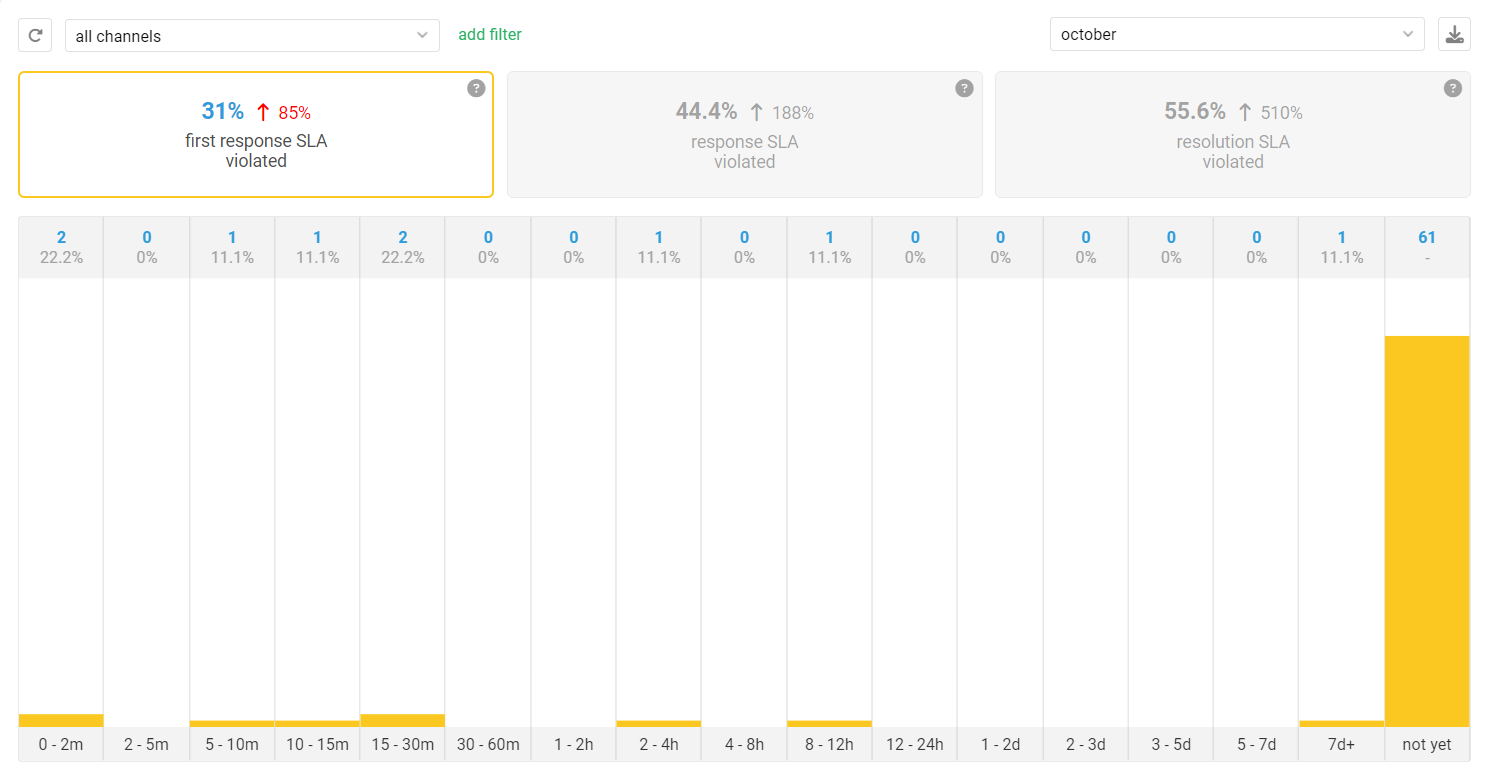
The subsection allows you to understand in how many cases the specified service level is not met. The intervals in the graph correspond to the values that can be selected in the service level settings.
All indicators have a "not yet" column, which shows responses and cases where the service level is not met, but agents have not yet sent a response or closed the case.
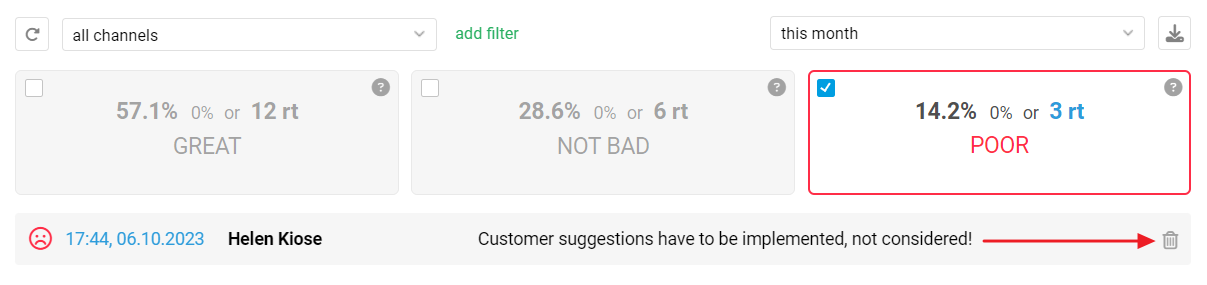
Satisfaction ratings
This section appears after activating the functionality for satisfaction ratings of agents' responses. It displays both general indicators with dynamics and the entire list of scores received by agents.
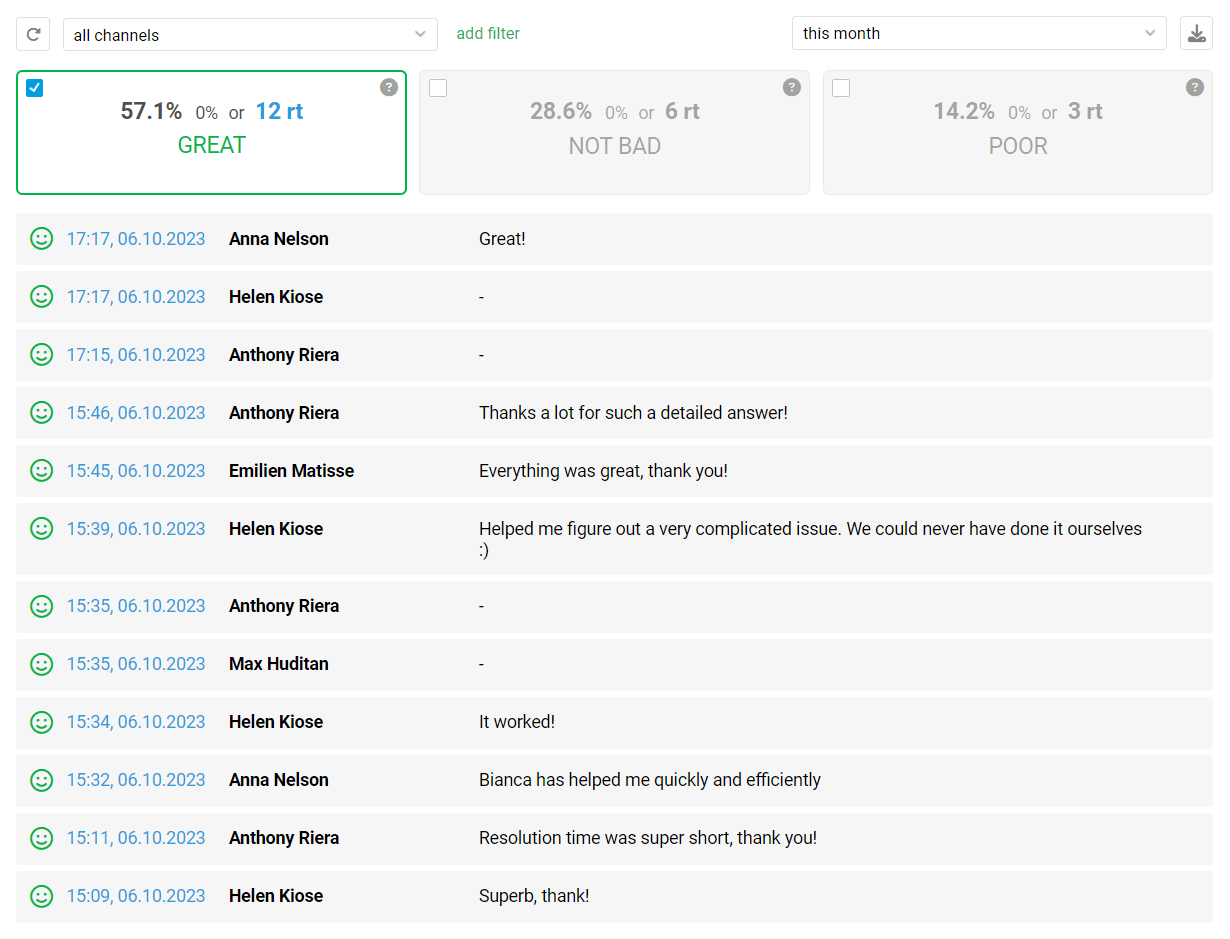
The administrator can delete ratings that he/she considers biased so that they do not spoil the agent's statistics. The icon for deleting a rating appears on the right side of the rating line when you put the cursor over it.
The logic of filters in this subsection is slightly different from the other sections of reports. Since the rating is always recorded for the agent who was the assignee at the time of the customer's rating, when selecting filters by the assignee, it is the one for whom the rating is recorded — that is, the one who was the assignee at the time of rating, and not the assignee currently set in the case.
At the same time, the filters by participants work as in other subsections — the case is rated for each agent who has sent at least one response in the case.
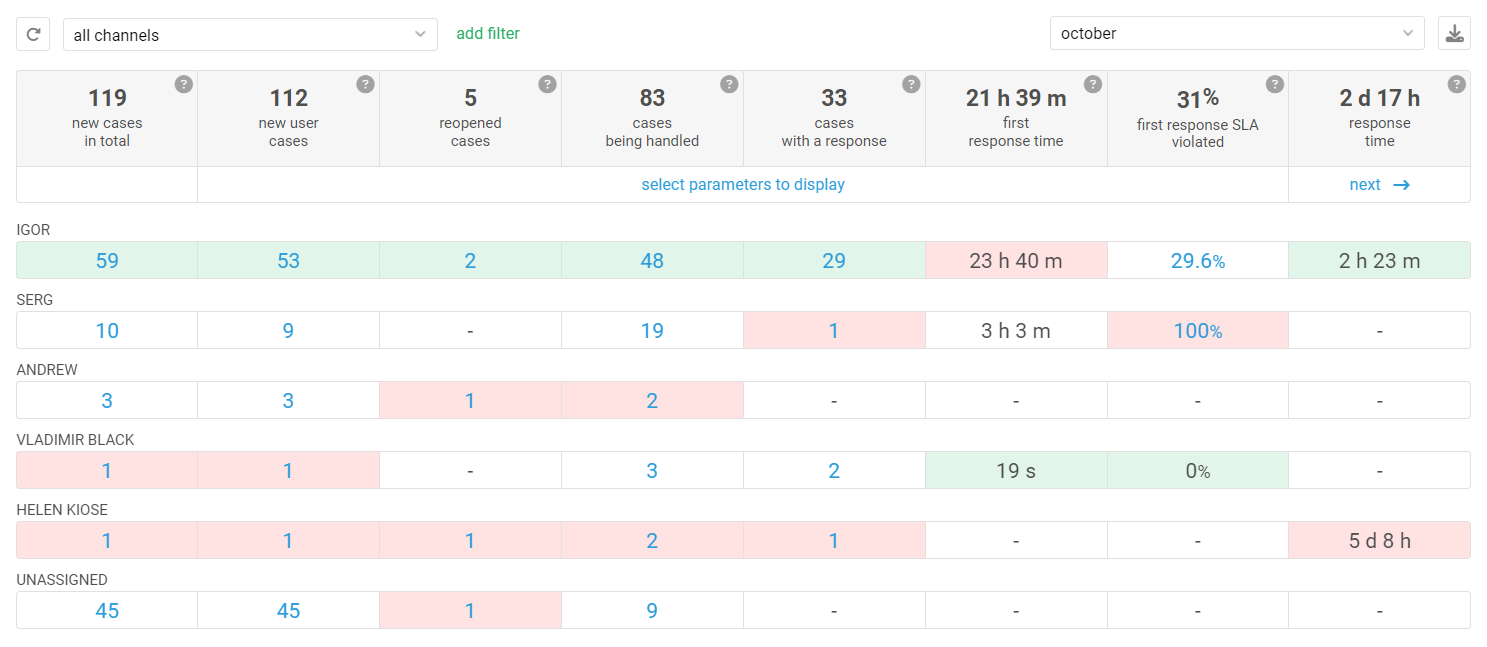
Leaderboard
This subsection is designed for comparing agents based on the most important indicators. By default, agents are displayed from the best to the worst, taking into account all data. For example, if an agent is the best in two indicators but performs poorly in others, they will not be listed first. The top spot goes to an agent who has more balanced indicators (the best in something and among the first in the rest).
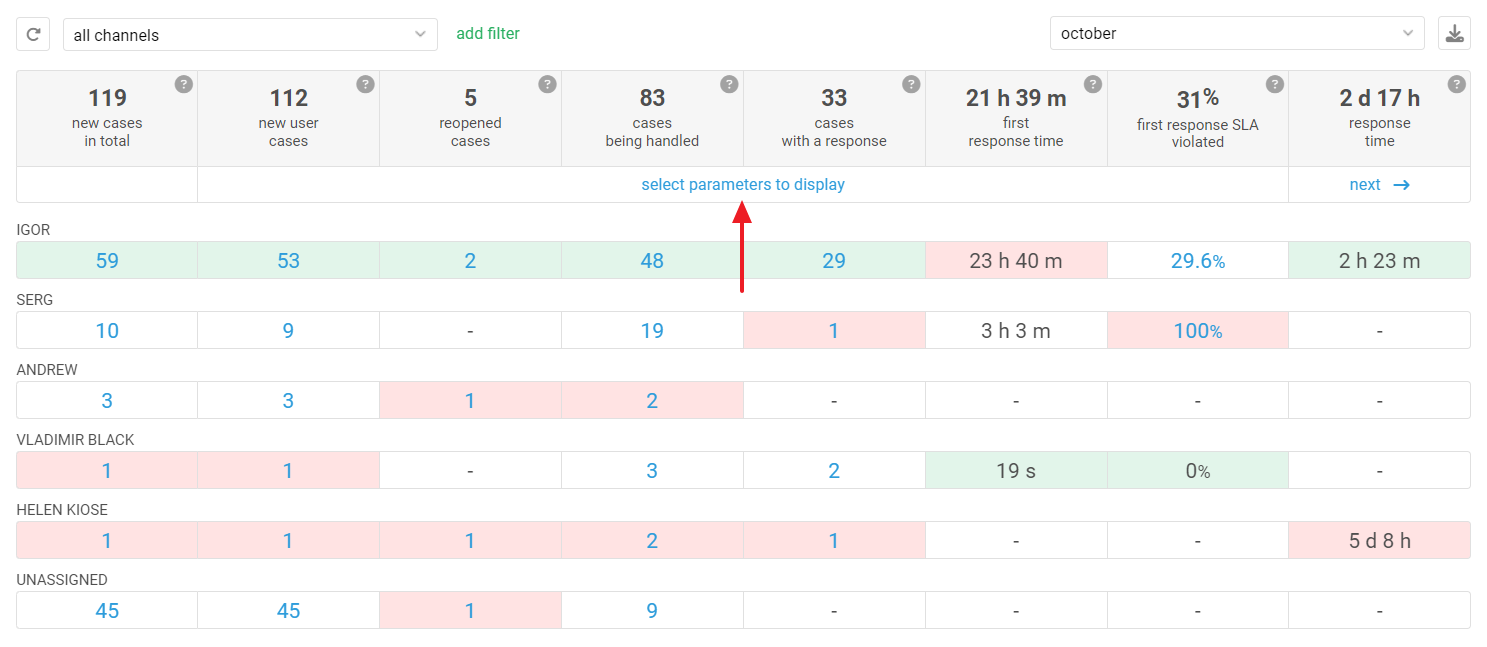
If you move the cursor over the table header, you can choose to sort by a specific indicator.
Since this section of the reports is the most important, 17 indicators are counted in it. You can choose which ones you need:
Brief statistics in the agent's account
The Dashboard section of an agent's account displays the same metrics as in the "Leaderboard" subsection.
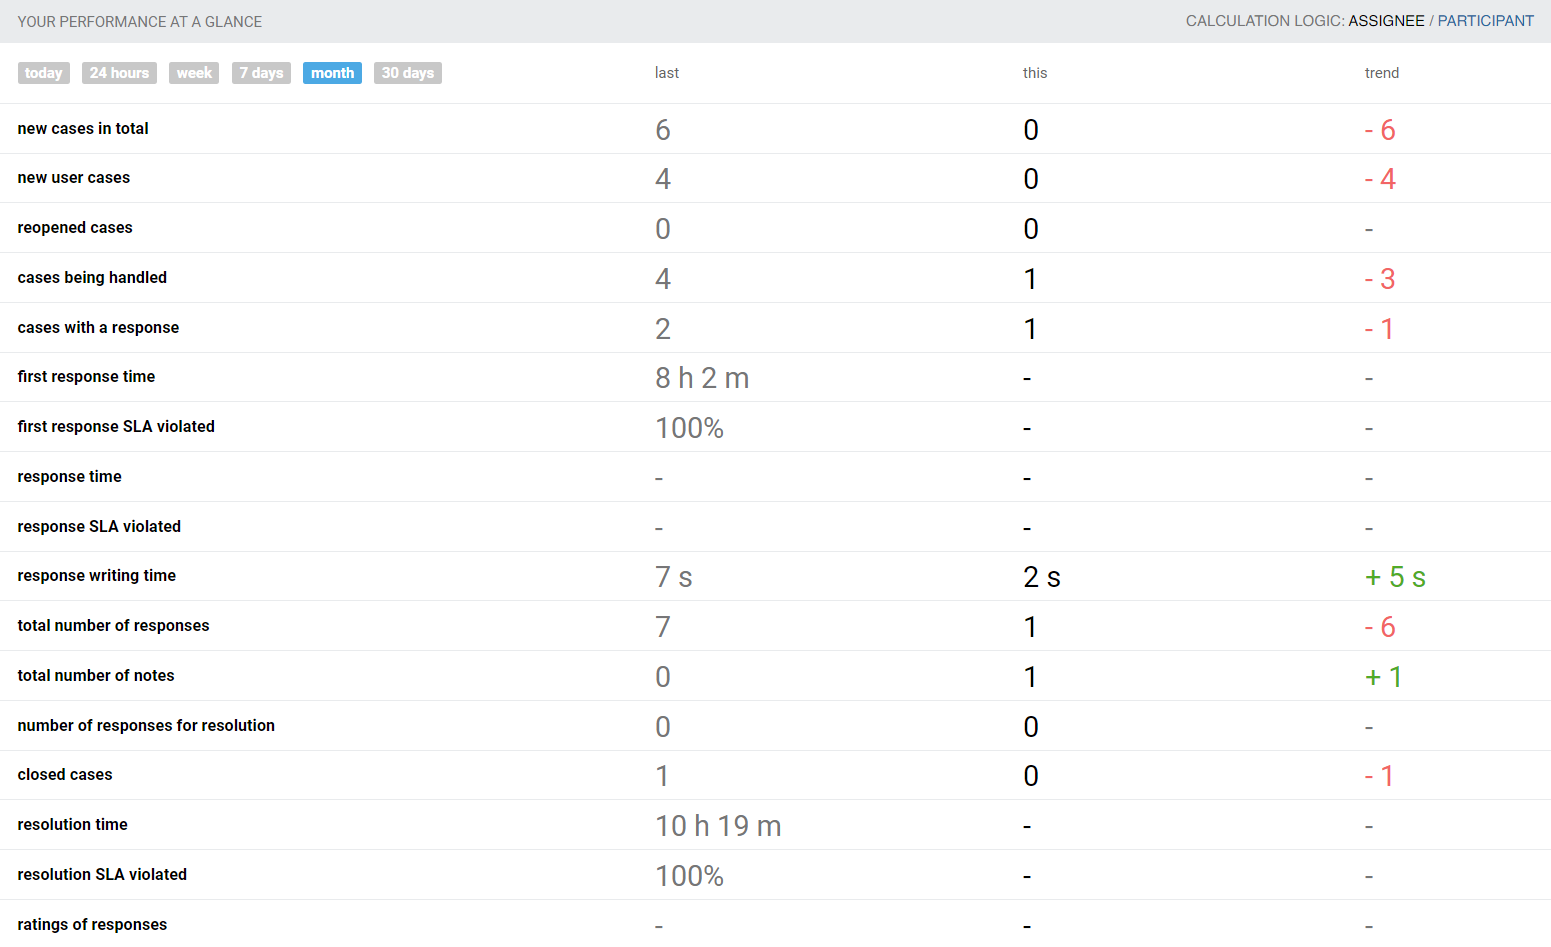
Agents also have the option to change the calculation logic — either based on the assignee or participant. This setting is saved individually for each agent, providing convenience when different departments within the company implement different calculation logic.